This chart came from the 2010 annual report for Barrick Gold, (or I suppose it's just called Barrick now) in the letter to shareholders section written by chairman and CEO Peter Munk.
He said that there is a lot of talk of gold in a bubble and showed this chart to prove that gold is not in a bubble. He said that in 1980, gold rallied 250% in a single year and that gold recently has done nothing close to that. The gradual rise in gold prices over the past decade has been orderly and not at all bubble-like.
I thought that was interesting for sure. But I still couldn't get over the parabolic-ness and one-decision-ness of the gold story so I decided to take a quick look at other bubbles in the past.
This, "gold is not in a bubble because there hasn't been a blowoff" argument vaguely reminds me of the housing bubble. Yes, housing prices are up a lot in the recent past, but they are not up like other bubbles in terms of magnitude. Yes, it's expensive but it could get more expensive, just like Japan did; we are nowhere near where Japan was etc...
Well, anyway, let's take a quick look at this.
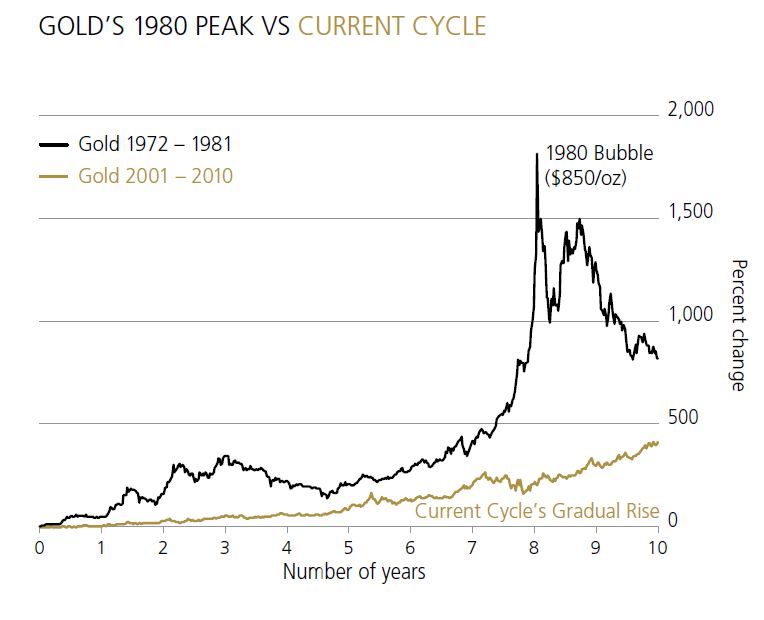
There is no question that compared to the 1970s, gold has done nothing and is not bubblish at all. But I have to wonder if this is a good comparison as gold prices were pretty much fixed for most of the 20th century; the delinking of gold from money caused a catch up in prices to make up for 50, 70 or more years of inflation.
This is certainly not the case now as gold has been freely traded for a long time.
Other bubbles that people use as benchmarks is the 1929 stock market bubble, maybe the 1987 crash as a minor bubble, the Nikkei 1989 bubble and of course the 2000 U.S. stock market bubble.
I'm way too lazy to do accurate work here, but just from eye-balling and grabbing quick prices off the internet, I came up with an approximate five year and ten year price change in these respective bubbles.
Here is what I got:
Price change over
Five years Ten years
1929 stock market bubble (DJIA): 4x 6x (actually from 1918 low)
1987 stock market bubble (DJIA): 3x 3x
2000 stock market bubble (S&P 500) : 3x 4.4x
2000 NASDAQ bubble: 6x 11x
Nikkei 1989 bubble: 4x 6x
Current Gold: 3x 7x
(to September 2011 high)
So looking at it this way, it does look to me like it is in line with other big bubbles. Again, I would think that the 1970s-1980 gold bubble may not be much of a comparable due to the extraordinary event that preceded the delinking (fixed gold price).
If we compare the recent gold price trend to other big bubbles, it looks pretty much in line. The 7-fold gain in gold prices in the past decade exceeds the gain in stock prices in both the 1929 stock market bubble and the Nikkei 225 1989 bubble and easily beats the 2000 stock market bubble.
In any case, I am not a big fan of gold at this point for the reasons I stated in my post back in October 2011 and I still think it is too much of an 'inevitable' investment;
- great historical track record in five and ten year periods that validate the bull story which is...
- the inevitability of central bank easing, almost perpetually due to weak economies and debt problems; money printing can't and won't stop, therefore gold prices must go up
- even if the central bank scenario proves false and the economy picks up steam, that would lead to inflation so therefore gold prices must go up
- So therefore heads I win, tails I win and, again...
- recent price performance confirms and validates above scenario (and gold sure beats the heck out of stocks and other assets on a five and ten year basis!)
- and we have all learned from the financial crisis that we can't have too much stock holdings or else we can lose money so we must diversify into other asset classes, like... [drumroll] gold!, because of the (go back to first bullet point)
So when the above self-reinforcing cycle is in effect and the chart looks parabolic (I am parabolic-phobic), and people tell you that in almost any scenario gold prices has to go up, I just lose interest in it.
Would I short it? Heck no. Am I convinced gold prices must crash or go down? Absolutely not. Can gold continue to go up? Of course!
When the bull case is that we are nowhere near the 1980-type of bubble and in order to make decent returns, such a bubble has to recur, it sort of sounds more to me like a gamble than a rational investment.
There are a lot of people way smarter than me that like gold and that's great.
For me? Nah. I want to own something that is unloved, hated, despised, and cheap. Gold right now seems almost the exact opposite.
Notes
Here is the 'rough' data I used for the above analysis just for future reference:
Nikkei 225 Index:
December 1979 6,570
December 1984 10,000
December 1989 40,000 (never got to 40,000 but that's what I used. Sue me!)
Dow Jones Industrial Average:
August 1977 860
August 1982 900
August 1987 2700
1918 low 66
1924 90 (eyeballed chart, so not very accurate)
1929 high 382
S&P 500 Index:
March 1990 340
March 1995 500
March 2000 1500
NASDAQ Composite:
February 1990 430
February 1995 790
February 2000 4700
Gold:
September 2001 270
September 2006 744
September 2011 1900
No comments:
Post a Comment
Note: Only a member of this blog may post a comment.