Thursday, June 28, 2012

Stubbing Bank of America

OK, I have to stop with these misleading post titles.  You can't really do a stub trade on Bank of America (BAC) as a stub can only happen when the piece you want to back out is publicly traded.

Anyway, with News Corp breaking up (after repeatedly saying it's not going to happen) and many calling for the big banks to break up, I thought it's a good time to look at BAC as a potential spin-off/ potential stub / sum-of-the-parts.

You know people will keep denying things until the day before something happens (remember Goldman Sachs?  Nope, we will not become a bank.  Next day, um, well, yes... we are now a bank, lol...)

I don't agree with the many people calling for breaking up banks that are too big to fail and too complex to manage but BAC is one bank where I would tend to think that wouldn't be such a bad idea.

In any case, a spin-off may not happen; the first quarter resegmenting of business units seems to make it more unlikely it will happen than not.   But who knows. 

Doing this exercise, though, will shed some light on what this beast really is made of so even if we come up with a similar sum-of-the-parts valuation as the "1% ROA for the whole firm" valuation we will have a little deeper understanding of the components that make up that value.


Use 2011 Year-end
Starting with the first quarter of 2012, BAC rejiggered their business segments.  They used to report two segments that were pretty much the old Merrill Lynch (with some old BAC tossed in); Global Banking and Markets  (GBM) and Global Wealth and Investment Management (GWIM).

In the 1Q 2012, they broke up GBM into two parts again, Global Banking (GB) and Global Markets (GM).   This is what they used to report a while back too, but for most of the time after the Merrill acquisition, it was reported as one segment, GBM.

That's all fine, but the problem is that when they broke it up again, they stuck some of the Global Commercial Banking into Global Banking.  The GB and GM together now is bigger than GBM back in 2011.

So instead of using the most up-to-date figures, I will use the data from 2011 year end as that is reported with the old segments.  Judging by their 1Q earnings report, there hasn't been anything dramatic so it shouldn't make too much difference analysis-wise.


How is the old Merrill doing?
So first of all, since we are focusing on the old Merrill and the hypothetical spin-off scenario, we need to look at how they are doing.  I will ignore what Merrill did before the crisis as it's a different world now.

So I decided to just take a look at how they have done since the crisis.  Since there aren't a lot of data points, I just looked at the quarterly figures.  Maybe I am tricking myself into thinking I have more data points by using quarterly, but at least I get to see more of what's going on inside this way.

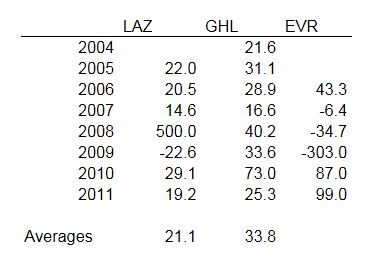
Here is the Return on Average Equity (ROAE) of what I call BAC-MER or the old Merrill Lynch compared to Morgan Stanley (MS) and Goldman Sachs (GS), the only two large independent investment banks.    I also included a four quarter average ROAE so we can see trends.

Return on Average Equity


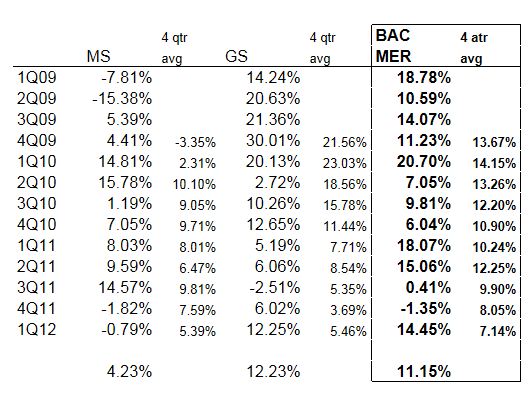
I took out some one-time figures from the BAC ROAE figures.  In the second quarter of 2009, BAC-MER's GBM unit had a $3.8 billion gain on a joint venture with First Data, and in the fourth quarter of 2009 the GWIM segment booked a $1.1 billion gain on the sale of Blackrock (The BLK stake was later moved to "Other" so I don't think the sale of the rest of it went through GWIM).

So in that sense, the BAC-MER figures should be pretty clean.  I may have missed a gain here or there, but I think the two above were the big ones. 

I didn't do the same for MS or GS; they are as they were reported so may include gains and losses here and there.

But anyway, it's very interesting to look at this table.  Since 2009, BAC-MER has earned an ROAE of 11.15%, solidly in the double digits; not far from what GS was able to achieve.  We can sort of see why MS is so cheap; it has only earned 4.2% in ROAE since the first quarter of 2009.

(DVA adjustments are included in all of these figures; GS is known to 'hedge' out there DVA volatility to minimize earnings impact from credit spread changes).

On a rolling four-quarter basis, it even looks like BAC-MER is doing better than GS (never thought I'd ever type that!) since the 1Q 2009.  In the full year 2011, BAC-MER had an ROAE of 8.4% versus GS's 3.7%.

So despite the nightmare of BAC, BAC-MER is doing fine and is even doing better than GS.


Valuation of BAC-MER versus Comps
The problem with a sum-of-the-parts now is that investment banks are trading pretty cheap too.  Since MS is doing horribly, let's compare BAC-MER with GS.

Using current stock prices and balance sheet values as of the end of March 2012, here is the valuation for BAC-MER comps:
         
                Stock                                                 Tangible
                price              BPS          P/B             BPS            P/TB
MS          $13.51             $30.74    0.44x            $27.37      0.49x                 
GS           $91.00           $134.48    0.68x          $123.94      0.73x

MS is not doing too well, so is trading pretty cheap.  But GS is doing well, sort of like BAC-MER, but it is trading at 0.7x book.  For valuation purposes, I would argue that a business earning double digit ROE's deserve to trade at book, particularly when the business is in a depressed state.

Let's see if I can find some support for valuing BAC-MER at book value.   Here is a table showing the book value per share (BPS), tangible book value per share (TBPS), stock price, P/B ratio and P/tangible book ratio for GS in the recent past.

GS Stock Valuation: Quarterly Since 1Q2009

We see that even after the crisis, GS has averaged around 1.2x P/B ratio and around 1.0x P/B if you look only at the past eight quarters.  It has averaged around 0.8x for the past four quarters, though. 

In any case, just by looking at this table it is not a stretch to see that these banks, if they earn double digit ROE's over time, they should be valued at or over book value.  The problem in the past few quarters is that there was the European crisis last fall that has continued this year.  So these valuations may reflect 'crisis' or 'fear'-based valuations.

Of course, there is always the possibility that the world will in fact end soon in which case all is moot. 

Another way to look at this:

GS has traded at an average 0.84x P/B ratio in the past four quarters while it earned an average ROAE of 5.5% during that time.   BAC-MER, however, in the past four quarters earned an average ROAE of 7.14%, 1.3x times higher than GS.  Yes, it feels strange to say that BAC-MER has done better than GS, but there it is.

So let's say a fair valuation for BAC-MER is 1.3x what GS has traded at.  That comes to 1.1x P/B (1.3x 0.84x = 1.1x).

GS has also traded at 1.0x book for the past eight quarters while it earned an ROAE of 6.6% during that time.  BAC-MER has actually earned an average ROAE of 8.6% during that time, or 1.3x better (this is getting really weird to keep typing that).  It would not be at all surprising if BAC-MER then also traded at 1.3x book over that period.

Yes, I know that sounds like I'm really reaching here.  But I'm just trying to justify book value for BAC-MER, not trying to get the highest valuation or anything like that (I'm not an investment banker representing a seller).

So looking at it in the following ways, you can easily justify valuing BAC-MER at book value:
  • A business earning double digit ROE over time should trade at book or more, and BAC-MER has earned double digit ROE since early 2009.  If one concludes that the current crisis is cyclical and not a permanent situation, then it's reasonable to assume that they will continue to earn double digit ROE over time, in which case book value is a reasonable valuation.
  • GS has earned double digit ROE since 2009 and has averaged a valuation of 1.2x book. Even excluding the perhaps overly exuberant 2009 rebound valuation, it averaged 1.0x book over the past 8 quarters.  BAC-MER has done at least as well (8.6% ROAE for BAC-MER versus 6.6% for GS), so a 1.3x book value valuation would not be out of the ordinary.
  • In the past four quarters, GS has averaged a valuation of 0.84x book value while earning an ROAE of 5.5%.  BAC-MER has averaged an ROAE of 7.1% so it would not be unreasonable for BAC-MER to be valued at 1.1x BPS.
  • Of course, many will insist on using current valuation and not some average valuation.  GS currently trades at a P/B ratio of 0.68x book, so even using current depressed valuations, BAC-MER can reasonably be valued at 0.9x book (0.68 x 1.3x).  
Of course if you think the investment banking model is dead, then none of this really matters.   None of this is going to be interesting.  But I tend not to think that way.


What's the Stub Worth?
So if we back out the old Merrill, what does that leave and what's the valuation there?

Here are the basic figures:


                                                        GBM                         GWIM                 Total BAC-MER
Total assets (period-end):               $637.8 bn                  $238.8 bn             $921.6 bn
Average equity:                                $37.2 bn                    $17.8 bn              $ 55.0 bn
Average economic capital:               $26.6 bn                      $7.1 bn              $ 33.7 bn

(I use average allocated equity and economic capital because that's what reported in the filings; any difference between that and period-end shouldn't change the conclusion.  Economic capital is basically tangible equity.)

At year-end 2011, there were 10.5 billion shares outstanding and the stock is trading currently at $7.60/share for a total market cap of $79.8 billion.

Backing out BAC-MER at book, that leaves a market cap of $24.8 billion.     On a per share basis, BAC-MER is worth, at book, $5.24/share, and the rest of BAC is valued at $2.36/share.

So what do you get for $24.8 billion?

Backing out the above capital and assets from the consolidated BAC will leave the balance sheet excluding BAC-MER:

                                  Consolidated              BAC-MER               BAC ex-MER
Common equity:       $211.7 bn                   $55 bn                      $156.7 bn 
Tangible equity:        $133.1 bn                   $33.7 bn                     $99.4 bn
Total assets:            $2,129   bn                 $921.6 bn                $1,206.4 bn

So BPS and tangible BPS of BAC excluding the old MER would be $14.92/share and $9.47/share respectively versus the market valuation of $2.36/share.

That values BAC at 0.16x book value or 0.25x tangible book value.  I know most people believe that the goodwill from the Countrywide acquisition is worthless, but management is guiding ROA of the whole firm at around 1.0% (including BAC-MER). 

Since BAC-MER has a much lower ROAE, this implies that BAC excluding BAC-MER will have an ROAE higher than 1.0%.

So even assuming a 1.0% ROA for the core BAC, that implies profit potential of $12.06 billion/year or $1.15/share.  At 10x p/e, that's $11.50/share for the core BAC.  Combining that with BAC-MER being worth $5.24/share, BAC as a whole is worth $16.74/share versus the current price under $8.00/share.

(You can also say that $12.06 billion/year is a 12% return on tangible book and and say core BAC is worth at least that.  Tangible book value per share for the core BAC is $9.47/share, adding MER back to that gives $14.71/share in value for BAC overall).

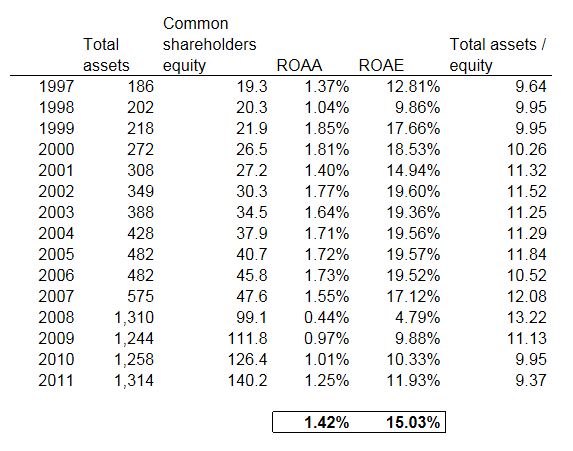
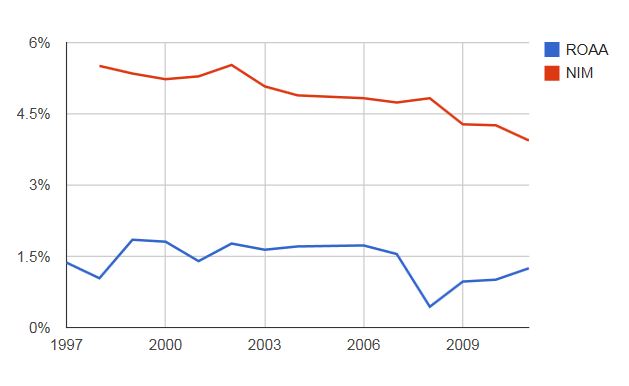
Just to check that, the following table shows the long term ROAA, ROE and ROTCE over time for BAC.

BAC Summary of Returns

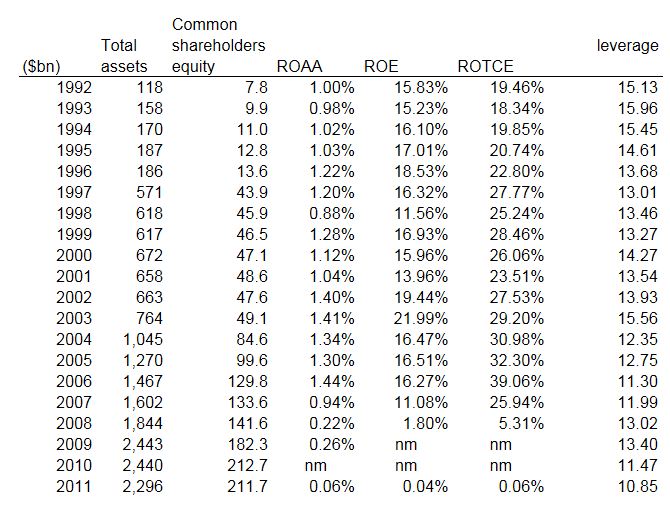
So it seems like in more normal times BAC does consistently earn ROAA over 1.0% and can be as high as 1.3-1.4%.  BAC has morphed over the years through multiple mergers, so I actually don't know how relevant some of the older figures are.  For most of these years, BAC didn't have MER (which was added to BAC in the first quarter of 2009) so it's a good indication of what the core BAC may earn.

But what we can say is that it seems like they earn sufficient ROE to merit trading at book.  You will notice that the leverage of BAC has come down over time.  Reduced leverage will certainly lower return on equity, but even at a lower 10x leverage and a 1.0% return on assets (BAC management's goal and Berkowitz' valuation assumption), that is a 10% ROE.

At this point, excluding BAC-MER, core BAC's leverage is down to 7.7x, and a 1% ROA would result in a ROE of 7.7% so that's on the low side.  The question is if BAC is holding back on leverage due to BAC-MER, or if they spun it off if they can lever back up to 10x.  

A conservative view, though, would be to see the core bank worth at least tangible book.

To get to core BAC being worth book value, one of two things would have to take place:  Leverage has to get back to 10-1 with ROA at 1.0% or ROA would have to get back up to 1.3%.  From the above ROA table, you can see that BAC hasn't earned 1.3% ROA in the 90s, but did so in the 2000s.  But that includes the bubble years so it's hard to tell what BAC can do over time on a normalized, non-bubble basis.

Comparing Core BAC and WFC
One reference point may be WFC.  BAC excluding BAC-MER would look pretty much like WFC.  Of course, WFC is way better managed, but Buffett owns both of them and thinks that BAC's underlying businesses are doing fine.

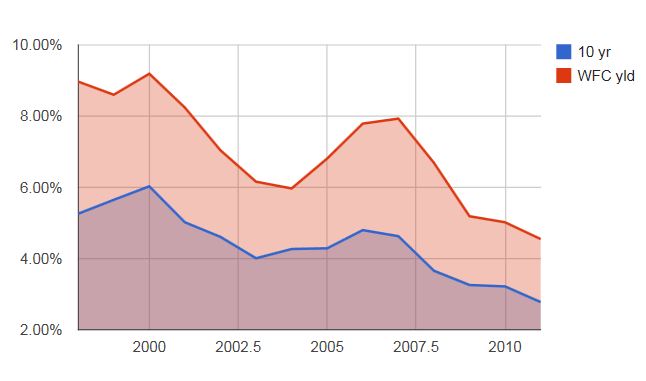
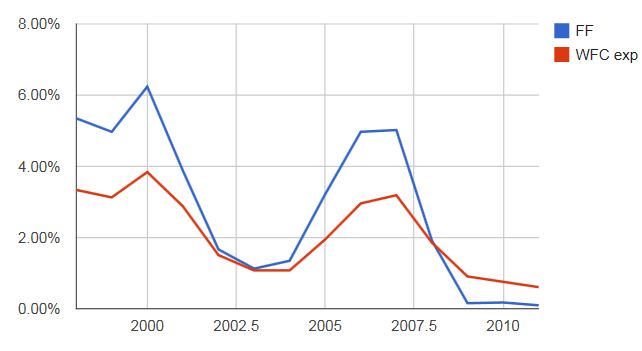
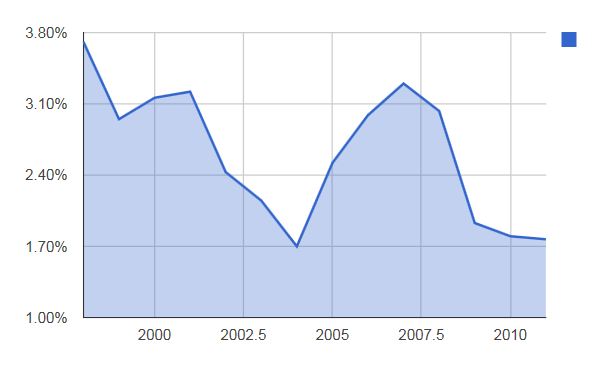
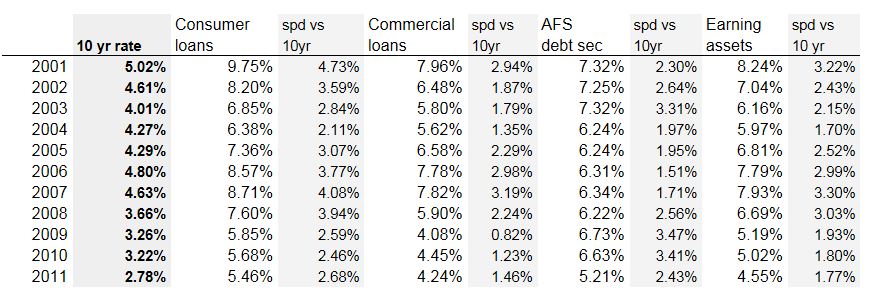
Anyway, I put the ROA of both companies side by side to see if what WFC is earning can be a hint to what BAC might earn:


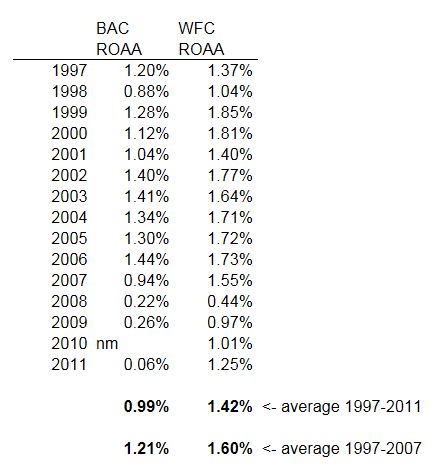
The interesting thing here is that although BAC has a history of earning well over 1.0% ROA, it has been consistently lower than WFC even before BAC bought MER.  The average ROA since 1997 for BAC is 0.99% versus 1.42% for WFC (actually, if you include a negative number for 2010 for BAC, it would be lower, but I am being generous here by leaving out 2010 which isn't even fair).

Excluding the bust, we get the same result.  BAC averaged 1.2% ROA versus 1.6% for WFC in the ten years 1997-2007. 

So unless we get a full recovery (including housing) in the U.S. economy, BAC (ex-BAC-MER) may not earn much above 1.0% ROA in which case the valuation for BAC ex-BAC-MER would be worth around tangible book or slightly more, but not stated book.

Review of the Simple Model for BAC Valuation
Berkowitz's valuation for BAC is simply that BAC can earn 1.0% ROA and with 10x leverage can earn an ROE of 10% so is worth book value, which at the end of 2011 was $20.09/share (tangible BPS was $12.95/share).

BAC in their presentations also present a base case "normalized" earnings scenario of at least 1% ROA.

If we go backwards, backing out BAC-MER at book value, we can figure out what kind of ROA the core BAC will need to earn to make a 10% ROE (to justify being worth book value).

Since BAC-MER (investment bank etc.) typically earns a far lower ROA than the core bank, in order for BAC as a whole to earn 1%, the core bank needs to earn a higher than 1% ROA.

We have already seen above that in order for core BAC to be worth book value, core BAC would have to either increase leverage (assets) 30%, or earn a ROA of 1.3%.  I don't know if BAC can grow assets 30% in this environment; getting to ROA through restructuring, costs cuts etc. might be more manageable.

But that is still not an easy thing to do given the historical ROA (see above table), the fact that BAC has consistently earned an ROA 30-40 bps lower than WFC.

Conclusion
In any case, either way you look at it, BAC does seem pretty cheap.  We looked at the two main pieces and I would be comfortable with the conservative assumptions, but the $20/share value might only be achievable in a broader economic recovery, especially housing.

It is encouraging that WFC is doing so well with 1.25% ROA with housing still flat on it's back, so BAC with a similar model (perhaps not as well managed) should be able to earn 1.0% ROA even without a housing recovery.   In that case, a $16.74 or so would seem completely reasonable (valuing BAC-MER at book value for the reasons I stated above and assuming a 1.0% ROA on the core BAC, valued at 10x p/e).   This valuation would not offend me, and I would tend to think it's conservative.

If you insist on giving an investment bank a 30% discount like the current GS (even though I would argue that since MER is doing better, they might need only a 10% discount), you can just knock off $1.60 (since BAC-MER is worth $5.24/share at book) from the above $16.74.   That would still get you to $15.14/share versus the current stock price of $7.60/share.

Of course this is not to say that BAC as a whole can't earn an ROA of 1.0%; BAC suggests they can do that on a normalized basis with no asset growth (implying no real housing recovery?).

So BAC may very well be worth $20 or more.

But picking apart the details, at least we know it can be worth at least $15.00 using our own assumptions (or $14.74/share with BAC-MER at book and the rest at tangible book).


Sunday, June 24, 2012

Lazard: Countercyclical Finance Play?

Nelson Peltz's Trian Partners bought a 5.1% stake in Lazard recently and has supported Lazard's new strategic plan.

I haven't looked at these independent advisory firms too closely in the past as they have usually traded at very high levels.  The other independent advisory firms are Evercore Partners (EVR) and Greenhill & Co (GHL).

Also, revenues are correlated to global M&A volume and whenever I see a graph of that it just looks like the Brooklyn Bridge; big upcycles where volumes shoot up during boom times and then slide way back down and stay down until the next upcycle.  I just don't know how you would put a multiple on earnings like that, unless you can buy an advisory at trough earnings for a reasonable multiple or something like that.

But Peltz's purchase gave me an excuse to take a close look at LAZ.  I looked at it briefly when it came public in 2005 but had no real interest in it back then for the reasons I state above.

Before I go on, there are some good presentations on LAZ that is worth a look (if you are interested in LAZ, of course):

Peltz's slide presentation was posted at Market Folly:
http://www.marketfolly.com/2012/06/trian-funds-presentation-on-lazard.html

Lazard's new strategic plan, slides and investor presentations are here:
http://www.lazard.com/Investorrelations/Presentations.aspx


Here's the long term chart of LAZ since it's listing back in 2005.  When it was listed, LAZ was run by Bruce Wasserstein, a legendary investment banker (He wrote a pretty good book about M&A; check it out here)


Anyway, why is LAZ so interesting now?    The main story is that if LAZ can get their compensation and benefits in line with peers, operating margins can be much higher and this would make LAZ a cheap stock at this point.

But others factors are:

M&A Ripe for Recovery
Trian and LAZ feel that the advisory business is at a low point and ready to move up as equity prices are reasonable (for M&A), financing is available, organic growth is limited at corporations so there is incentive for acquisitions, corporate balance sheets are healthy and CEO optimism is on the rise.  So the M&A business is ripe for recovery.  Trian points out that when M&A starts to recover, it tends to go on for a few years.  Here's a chart from their presentation (see, I told you it looks like the Brooklyn Bridge):


Here's a longer term look at M&A deal volume from an Evercore presentation:


Fee-based Business Model
LAZ's business is in advisory and asset management.  Neither of these are capital intensive; they don't use the balance sheet.  In this environment of concern for potential losses at financial firms (not knowing what's really on the balance sheets), this is a positive.    I don't have too much concern about financial balance sheets (at least at the good firms like JPM and GS), but a fee-driven model can be interesting as long as it's not too expensive.  Also LAZ would not be affected by much of the new regulations (Volcker rule, capital ratios etc.).

Independence
LAZ is an independent advisory firm as opposed to a full service bulge bracket investment bank,  and this can be an advantage these days with all the problems of conflicts of interest that seem to plague the big banks.

Countercyclical Nature
I did call this a countercyclical play and of course, that may be overstating it.  It's a play on financials and LAZ will do well on a global economic and market recovery.  That's the scenario that will make them the most money.

But, like Oaktree Capital Managment, there is a countercyclical component here.  Oaktree tends to raise funds and invest in bad times and do less in good times. They manage themselves in that way for good long term performance.   But still, in a bad market, the funds that OAK manages will probably not do too well.

In the case of LAZ, they are a fee-based business so bad times will reduce fee income and they won't do well either, but their advisory business in restructuring tends to do well providing a built-in hedge to the overall business.

Check out this slide from LAZ's presentation:


Notice how the restructuring business did really well back in 2003 and in 2009.  If you think there is still way too much debt out there and there will be a lot of restructuring needed over the next decade (in Europe, for example), it does seem like LAZ can be a big player in this area.

David Einhorn bought some Oaktree recently, and I think that is sort of a countercyclical play for him too.  Of course, I have no idea what he is thinking, but since he does tend to think that things can really blow up in some places due to excessive leverage it makes sense that he would be interested in investing in someone who would know how to pick up the pieces and make some good money.

LAZ has that aspect to it.  Notice how revenues actually went down in 2004 versus 2003 even though nonrestructuring advisory revenues went up; restructuring did so well in 2003 it caused revenues for the advisory segment to go down in 2004.

The 2009 increase in the restructuring business proved to be quite an airbag for the business.   Restructuring revenues went up from  $119 million to $377 million.

Here's a slide from LAZ's investor presentation that should get Einhorn and other people looking for serious debt-related dislocations around the world in the next few years excited:


When things really unravel, LAZ may very well be a big beneficiary of that.  So you think big bankruptcies are on the way?  Have I got a stock for you!


Asset Management is Basically Equities
This is a slide from LAZ's investor presentation:


The other half of LAZ's business (net revenues) is asset management.  What surprised me here is that most of their assets are in equities.  From the above table, you see that equities is 82% of total assets under management (AUM), and a lot of that is in international and global equities.


People will have different views about this, but I tend to think it's a good thing.  Everyone else seems to be rushing into hedge funds and alternatives.  I do think that stock prices are reasonable and believe they will do better than most people think (funds seem to be rushing out of stocks into alternatives).  


 And AUM has risen nicely over the years, recovering the 2007 highs, and operating revenues are already above 2007 levels.

There isn't much detail provided about the actual funds; I would like to see more of that like asset managment firms typically show in their filings.

But one thing I did notice is that throughout the crisis, from 2007-2010, the asset management business had net inflows into their funds every year which is interesting.  Most of the AUM is institutional and the funds do seem to be sticky so far. 

There is some comfort in knowing that LAZ is increasing AUM in equities while we know that institutions are rushing out of stocks and into alternatives. It's much more comforting than an asset management firm that is growing AUM due to the current rush into alternatives (which may or may not pan out).   LAZ seems almost contrarian.


Trian's Valuation Case
Trian's case is pretty simple.  Management announced a new strategic plan in April of this year and said they will target at least 25% operating margin by 2014.   Trian simply took that figure and adjusted 2012 estimates to get a 'normalized' earnings figure and comes up with $2.50/share in EPS giving LAZ a less than 10x p/e multiple.


Trian also shows what LAZ could be worth in various margin and revenue growth scenarios.  LAZ could be worth anywhere from $42 to $61/share depending on if operating margins are 25% or 32% and revenue grows 4% - 8% per year through 2014.

Trian uses a 14x p/e multiple, which is reasonable.   If you want to be conservative, you can put a 10x multiple on it and say LAZ can be worth $30 - 43/share  by 2014.


LAZ Strategic Plan
LAZ's plan is pretty simple.  They want to increase return to shareholders.  They are increasing dividends and plan on doing more share repurchases so that shares outstanding go down instead of going up (repurchase more shares than it issues as compensation).

That's a good thing, and I sort of wonder if something like this would have happened under Wasserstein or some such "star". 

The key for the plan is getting expenses down in line with peers.  Here are some slides that show how LAZ plans to get to 25% operating margins.

Compensation Expense
Below is a table that shows that LAZ has compensation expense that is much higher than peers.  Getting this down is key to improving operating margins.  The table also shows that they are making some headway in this expense control.  During the years 2006-2009, compensation expense averaged 69% of revenues, but that got down to 62% in 2010/2011.  Their goal is to get that down to 55-59% which is around where the peers are.

I should note that in this table and in LAZ compensation discussion, they use what they call "awarded compensation" as opposed to GAAP compensation; they feel it more accurately reflects costs as incurred.  If someone earns a certain amount of income but it is deferred, it should be charged to when it was earned, not when it is paid out etc.   That seems reasonable and fair to me.   Payout timing can be completely arbitrary.

This table shows LAZ's compensation ratio versus the peer averages:


...and this shows Non-compensation expense, which looks good versus peers:


And the result is the operating margin:


Peers have averaged around 25% operating margins in 2006-2009 while LAZ's was only 12%.  They have since improved that to 18% in 2010-2011.   Their goal is to get that to 25% by 2014. 


No Improvement Scenario / Sanity Check
Just to do a little of our own checking, here is some historical data from the LAZ presentation:


Here is the table of earnings based on awarded compensation.  To do our own scenario (versus Trian's scenario), first let's just make sure we got this model correct.

The above table has adjustments to it that are footnoted in the LAZ presentation.  

All we want to do is to be able to manipulate the operating margin, revenues and get our own awarded EPS.

Operating revenue in 2011 was $1.9 billion and awarded operating income was $321 million.  To get from the operating income of $321 million to $1.34/share in EPS, we have to deduct interest expense, taxes and then divide by diluted shares outstanding.  We will use 2011 figures to see if we can get from $321 million to $1.34:

Interest expense in 2011 was $90 million and the tax rate was around 20%, and there was 137 million shares outstanding.  So $321 million less $90 million is $231 million, less 20% in taxes leaves $185 million or so.   With 137 million shares outstanding, that's $1.35/share in EPS; close enough for a free blog.  

Worse Case Scenario
OK, so this is not a worst case scenario.  You can't really do worst case scenarios for financials because if we have an extended recession / depression, you can't really model that.  Obviously, in that scenario, LAZ would not be a good bet.

So my downside scenario is just that the M&A business doesn't recover and LAZ's revenues just doesn't grow.  I do think that using the average revenues of the last three years is conservative because the financial industry is in a depressed state now, and the years 2009, 2010 and 2011 are sort of trough-like (see the long term M&A volume chart earlier in this post).   We can assume that the conservative scenario is that M&A volume does NOT pick up and revenues don't grow as Trian's slide shows.

Using 2011 figures from the above model, I will just plug in the figures using revenues that is the average of the last three years and then various operating margin levels and all other factors the same (tax rate, interest expense and shares outstanding same as 2011):


So if the M&A business just muddles along at recent lows and LAZ earns the average revenues that it has earned in past three years, the EPS would be as shown above according to various margin levels.  Since Jacobs took over and restructuring has taken place, margins has averaged 18%.  If this can be sustained, even at current low revenue levels, LAZ can earn $1.40/share giving the stock a p/e ratio of 18x, or an earnings yield of 5.6%.

Clearly, this is not an attractive valuation for a steady-state, no improvement situation.  If they can get their margins up to 20%-25% range, the valuation becomes much more reasonable in the 11-15x range.

For those who might have an issue with tax rates, I added pretax figures.  We know that Buffett likes to pay 10x pretax and Leucadia wants to make 15% pretax returns, so those are pricing benchmarks (not that they would be interested in investing in LAZ).

On a pretax basis, even with volumes stuck at recent lows and not picking up, if they can get their margins up to 20% or so, they can still earn 8% pretax return on the current stock price; not bad at all.

Lower Interest Expense Scenario
OK, so let's take it one step closer to Trian's scenario.   In Trian's slide, he assumes further share repurchases (slightly lower shares outstanding) and higher revenues, but notably he has a much lower interest rate expense.

This is because the long term debt of LAZ expires in 2015 and 2017 and they yield 7%;  the assumption is that they can pay down some of the debt and refinance the rest in 2014.  To come up with a $46 million interest expense figure, they took the current debt at market value of $1.17 billion or so and deducted $200 million in excess capital and then applied the current trading yield levels for LAZ debt of 4.7%.

This is not at all unreasonable because it reflects debt at market and current interest rate levels for LAZ.  For normalizing earnings over time, this is a fair assumption.

Also, Trian uses a 25% tax rate, so I will bump that up to 25% too. 

Redoing the above spreadsheet, we get:

With this lower interest expense, LAZ looks a lot more interesting.  Even with no improvment in revenues, if LAZ can maintain an 18% operating margin, LAZ is trading at 16x p/e ratio.  On a pretax basis, it would be earning 8.3% on the current stock price; not bad at all given the conservative assumptions.

If margins improve, to 20-22%, then it gets reasonable pretty quickly.  These independent advisors, because they are not capital intensive (and don't have balance sheet risk) tend to trade at much higher multiples than full service investment banks and universal banks.

Here is a table of historical P/E ratios of the independent advisors; I just pulled these from Morningstar:

Historical P/E Ratios

The averages exclude negative numbers and the 500x p/e in 2008 of LAZ.  I didn't bother with EVR since as you can see, it would be pretty meaningless.

This is not to suggest that LAZ has to trade at 20x p/e or more, but it would not be out of historical norms. 

Yes, it's a different world now.  Some will argue that if you look at it that way, then banks should be worth 3-4x book value per share.  Fair enough.  But I do tend to think there is a better chance of advisory companies having a high multiple than banks going back to 3-4x book again (capital / leverage has been reduced etc...).  These independent advisories won't be restricted by tighter capital rules or the Volcker rule, and don't have the balance sheet risk that is the cause of lower multiples at other financials these days.


Conclusion
So that's just a quick look that I now admit is a neat idea.  A play in the financial sector that has no balance sheet or regulatory risk, no (or minimal) conflict of interest issues.  No big accidents waiting to happen.  

It's a business that is basically a services business that earns fees.  Yes, it may be run by a bunch of untrustworthy, greedy bankers (not my judgement) but the new, post-Wasserstein CEO seems to be much more shareholder friendly with actual proof of that (more share repurchases, increased dividends and lower compensation expense ratio).

The M&A market, even I admit, is probably not dead and there are probably a lot of deals to come in the future for the various reasons sited in these presentations, and the market is probably at a cyclical low point following the financial crisis and the current ongoing European crisis.

This stock does have an airbag built in so if things get really hairy and bankruptcies and restructurings boom again, LAZ has a dominant position that can boost revenues to offset declines elsewhere.

Of course, this is not the cheapest stock out there, say, compared to Goldman Sachs or JPM, but it is still an interesting story nonetheless.


P.S. About Financials
I do tend to talk about financials here a lot, but I would caution that it doesn't mean one should necessarily own a lot of financials.  Financial stocks are volatile and if we have another recession, financials will get hit hard.

I talk about financials here a lot, mostly because they are unloved and hated but also because I have some comfort with them that others probably may not have.  Having worked in the industry, I am probably a little more comfortable with, for example, JPM's humongous derivatives book and other things people would run away from.

This is not to say that bad things can't happen.  There are risks in these things.  If someone told me that they had 80% of their net worth in Berkshire Hathaway, I'd say, cool.   That sounds fine (even though BRK did go down 50% during the crisis too).

But if someone said they had 80% of their net worth in Goldman Sachs or JP Morgan, I would say, hmmm.... you might want to think about that.

Greenblatt, in his genius book talks about concentration, but warns against being overly weighted in any single sector.  Five to eight stocks may give you enough diversification to get through market volatility, but not if all five of them are financials!

Anyway, I have said this before but I just wanted to point that out.  I don't talk a lot about financials here because I think people should be heavily weighted in financial stocks;   I do think they are cheap, but I post about them because I feel comfortable talking about them and feel like I have something to say about them.


Thursday, June 21, 2012

The Real Cause of Financial Crisis: Money Market Funds

OK, so that's a dramatic statement.  This post will no doubt come across as way too sympathetic to banks, but since I see that the SEC is looking into money market funds, I thought I'd make a post about it.  

This has been a pet peeve of mine for a while.  The banks have been really tarred and feathered since the crisis.  Sure, a lot of what they did was wrong.  Many people made mistakes.  Everyone participated in the bubble, so I don't mean to say that banks are guilt free.

But I do think and have thought that the focus on banks has been overdone, especially in the press and in Washington DC.  I remember reading an article in the Economist about what Washington is doing to banks and a writer said that it's like a bar brawl; when a fight breaks out in a bar, you don't go after the guy who started the fight.  You just turn to the guy sitting next to you that you never liked and hit him.  Not because the brawl is his fault but just because you don't like him and now is a good time to hit him.

That really sounds spot on to me (what does the financial crisis have to do with credit card fees?).  When the banks are down, people pile on.  It was a good time to just hit and kick the banks since they were already on the floor.

It seems that there is so little focus on trying to get to the root of the problem.

Volcker Rule, FHA Loans
I remember reading all this stuff about the Volcker rule and hearing at the same time that even *after* the crisis, the FHA was guaranteeing mortgage loans with only 3.5% - 5% down.  I was like, "huh?".  We want to stop the banks from trading their own capital (proprietary trading, by the way, had nothing to do with the financial crisis.  Merrill Lynch got killed on warehouse/inventory positions.  Same with Morgan Stanley.  It's true that some of the positions may have been shifted into proprietary positions once the securitization markets froze, but the positions were all related to the mortgage "machine" which is all customer-related).

I am one of those people that think that maybe if mortgages were required to have 20% down payment the bubble/collapse wouldn't have happened, or it wouldn't have been as extreme.

Instead people focus on the "evils" of banks.

Glass-Steagall / Too Big to Fail
I always thought Glass-Steagall was outdated, especially because of the disintermediation of the economy over the years.  In the old days, companies relied on banks for loans, but as the financial markets matured, the bond market became a bigger part of fund-raising for companies.  It made no sense to me that a bank would be able to offer loans but not help it sell bonds.  Loans are syndicated and resold too; why wouldn't they be able to offer stocks and bonds?

Also, much of Europe didn't have the same distinction so U.S. banks would be at a disadvantage versus European universal banks in an increasingly global economy.

Anyway, I don't mean to debate all of that here, but my point is that Glass-Steagall may have contributed to the crisis in indirect ways, but I don't think it was a big factor.  The big bankruptcy that froze the financial markets and almost plunged the world into a global depression was Lehman, and they weren't a bank.  It was an investment bank.  Bear Stearns wasn't a post-Glass-Steagall universal bank.  It was an investment bank.  Merrill Lynch was also an investment bank.  The biggest busts, Fannie Mae and Freddie Mac weren't 'banks'.  AIG was not a bank or an investment bank, and they were probably one of the biggest factors in causing this collapse.

Too big to fail?  None of the above banks/investment banks that failed were really "too big".  The only big bank that had a problem that fit "too big to fail" was Citigroup, I think.  J.P. Morgan was never at risk.  Bank of America, I think, was fine until they acquired Countrywide and then later Merrill Lynch.  But up until then, I think they were fine and would have come through the crisis with no problem.  They only became "big", probably at the encouragement of regulators.  As Buffett said, they may have unwittingly saved the financial system in 2008.

We Survived Bear Stearns, Wamu, Countrywide etc.
So anyway, getting back on topic, I sort of think that in 2008 we were fine even with Bear Stearns, Wamu, Countrywide, Indymac and others going under.  Buffett thought the authorities drew a line in the sand and the worst was over after JPM bought Bear Stearns.

But boy, was he wrong. 

So what went wrong?

Money Market Funds (MMF)
I still think the market would have been able to deal with a Lehman bankruptcy.  What was not predicted at the time was the extent that MMFs were exposed to Lehman paper.  When the Federated Funds "broke the buck", that's when all hell broke loose.

This, I think, is what caused the near depression. When you look at economic figures and comments from CEOs around the world, the Lehman bankruptcy is what caused money to stop flowing and phones to stop ringing.  This is when the economy basically had a heart attack and just stopped functioning.

But it wasn't really Lehman itself that was the problem.  It was the MMFs.

How can MMFs do this to the global economy?

Let's look at what happened.  Read the 2008 J.P. Morgan annual report and Jamie Dimon talks about what happened in September 2008.  Here are some snips regarding MMFs (Dimon only points to this as one of the many causes):


And later in the report:


So let's think about this for a second.  $700 billion fled money market and bond funds in two weeks.  Of that, $500 billion was money market funds.  That's an astounding number. 

For reference, here are the total deposits as of December 2007 of some of the largest U.S. banks around that time (I used 2007 instead of 2008 because of some large mergers that happened in 2008; 2007 would show more what the typical bank looked like before those emergency mergers):


Deposits at Big Banks, December 2007

J.P. Morgan:                   $740 billion
Citigroup:                       $826 billion
Wells Fargo:                   $311 billion
Bank of America:           $805 billion

So $700 billion fleeing bond and money market funds is like a real bank run of tremendous magnitude.  Even if we just look at the money market funds, $500 billion moving out is like having a total bank run on one of the largest banks in the U.S.  Can you imagine what would happen if there was a real bank run at Citigroup or JP Morgan?  Yes, the economy would collapse.  You can't have $500 billion flee like that and not have a huge impact on the economy!

(I know there are people that would argue that it makes no difference because cash moving out of one place will just move to another so net-net, nothing changes.  But that's not how the market and economy works; when there is a panic and money moves out, yes, they move into treasuries and other risk-free assets and deposits at 'safe' banks and yes the sellers of those treasuries would use that money to redeploy it elsewhere.   But that doesn't happen immediately and that disruption is what causes chaos; not any real disappearance in cash).

The FDIC and the Fed is designed to prevent this.  Notice that no matter how much trouble Citigroup was in at the time, I don't recall anyone withdrawing their deposits.  Even at Wamu and other 'failed' banks, I don't remember hearing anyone moving their deposits out.  There were some cases like Indymac, but I think most failures happened smoothly in terms of transferring deposits to strong banks.

This is precisely what the FDIC is for, and it worked as it is supposed to.

But the problem was that there was no FDIC for money market funds, and the MMFs didn't have to put up any capital to support their assets.  Now think about that;  MMFs can do business with NO CAPITAL to support their assets, and yet they are allowed to pretty much guarantee principle. 

How can that be?!

The banks can guarantee deposits up to the FDIC amount because the FDIC backs the deposits (well, actually, the banks don't guarantee anything; the FDIC does).  And for that guarantee, banks pay the FDIC fees.

So the MMFs were like banks with 0% Tier 1, 2, 3 or whatever capital.  Yes, they are short term and don't make long term loans and yes, they are limited in the credit risk they can take.

But they did take a loss on Lehman paper. 

The funds are fighting all sorts of regulations to correct this anomaly.  I don't think they should be allowed to guarantee principle without either an FDIC-like government backing or some capital to support the guarantee.  It just makes no sense at all.

If they only make short term loans, and only to high quality credit, then the government guarantee fee would probably be pretty low, or the capital requirement would be low too; much lower than at banks.

Anyway, to me, that's a huge hole in the financial system that seems like a much bigger problem than anything else I hear people talking about; hedge funds, derivatives, Glass-Steagall, proprietary trading etc...   None of those things, to me, are remotely close to being an issue compared to the MMFs.

It is so ironic that people seem so focused on the complex and rail against it while overlooking the huge risk that exists in the simple, plain vanilla thing that I personally think had a far bigger role in the near collapse of the global economy.

Don't get me wrong.  There was a problem in back in 2008 and we would have had some sort of recession.  I don't mean to say that nothing would have happened if MMFs were properly insured or capitalized. But it does seem to me that it was the single, biggest factor that changed a typical credit boom/bust cycle into a near collapse; look at the economic figures *after* September 2008.  That was not because Lehman ceased to exist.   It was because of a huge 'run' on MMFs.

Anyway, I know this is a controversial issue and many will not agree, but that's OK.  Again, I don't write this to find people to agree or disagree.  I just wrote it because I don't hear this point of view all that much.


Monday, June 18, 2012

Net Interest Margins etc.

I mentioned recently that what I fear most for U.S. banks is what happened in Japan; low interest rates for a long time.  If long term interest rates keep going lower, this will put pressure on bank net interest margins and therefore profits.

So I decided to take a quick look at this and found something interesting.   People used to use yield spreads as a proxy for bank profit margins.  The ones that you would hear about were the 10 year treasury rates versus 2 year rates or Fed Funds rate or some such thing.  When that was wide, bank margins were wide and vice versa.

Anyway, the following are just some thoughts.  Don't read this if you want answers.  I have no idea, frankly, if the U.S. will follow Japan; I have no idea how long interest rates will stay low.  I do actually have a hunch that it will stay low for a lot longer than most people think, though, but that doesn't mean I think we are in for a Japan scenario.

And keep in mind, I am not predicting a Japan scenario here.  It is my personal, primary risk scenario, not the base-case scenario.  My base-case scenario, perhaps naively, is that we just muddle along and do OK.  Other risk scenarios are of spiking interest rates and hyper-inflation.  I tend to lean more towards the deflationary collapse risk side than the hyper-inflation side.

In any case, I don't know which we will see if any.  This post will not try to answer that question, nor will this try to figure out if WFC and other banks are good buys here or not.  I just wanted to take a closer look at the moving parts, that's all.   Think of it as a meditation on NIM, or whatever...

Yield Curve Spread
Anyway, since NIM is my primary concern,  naturally, the first thing I should look at is the yield curve spread.  Here's a long term and shorter term chart of both yield spreads:

Yield Curve Spread
(10 yr versus FF rate and 10 yr versus 2 yr, annual data)


This is the two spreads going back to 1985.  Any further back may not be as important due to Reg Q (regulated interest rates) etc.   This chart goes to the end of 2011.  So despite very low long term rates, as of the end of 2011, spreads were still at the *upper* end of the range since the 1980s.  Of course, that's due to the very low short term interest rates.   As of the end of 2011, you can safely say that the low interest rates on the short end of the curve has been very beneficial to banks.

Here's the same data on a monthly basis since 2000 and through the end of May:

Yield Curve Spread
(10 yr versus FF rate and 10 yr versus 2 yr, monthly data)


So even including the recent plunge in long term rates, the spread is still just about in the middle of the range; the spread is not abnormally low at all.  1.8% is the end of May figure (actually, average for the month of May) for the 10 year treasury rate, and as of now that's 1.62%.

So far, even though long term interest rates have come down to abnormally low levels, thanks to the super-low short end, spreads are still within 'normal' range.

That's good news; despite declining long term rates, the yield curve is still positively sloping enough to be 'normal'.

Yield Curve Spread and NIM
So how does the above compare to bank NIMs?    Here is some annual data for Wells Fargo (WFC) going back to 1998 or so.  I plotted the NIM against the 10-2 Treasury yield spread.

Wells Fargo NIM vs. 10-2 spread
So here again is good news and then bad news.  The good news is that WFC's NIM doesn't seem too correlated to the spread.  That is due to various factors; asset-liability management, the maturity of loans (so don't reprice immediately etc).   The yield curve flattened in 2000 and 2005-2007, but WFC seemed to maintain their NIM.  That's the good news.

The bad news is that NIM has been trending down over time regardless of the spread.

Here is the NIM for all banks from a FED website.  It's the quarterly NIM for all banks.  This too, shows a steadily declining trend in NIM regardless of the yield curve.


This is from an FDIC study on net interest margins and yield curve spread back in 2006.  They do note the decline in correlation between bank NIMs and the yield curve:


Just for reference, here's the 10-year yield:

10-Year Treasury Yield (annual averages)


So What Does That Mean?
Since the yield curve spread isn't helping us see what's going on with NIM, let's take a look at the actual components.

First, we'll look at the asset side of the balance sheet. 


Yield on Interest Earning Assets at WFC versus 10-year Treasury Yield
 Since 1998, the 10 year Treasury yield has declined from 5.26% to 2.78% and the yield on earning assets at WFC declined from 8.97% to 4.55%.


WFC Funding Cost versus FF Rate 
On the liability side, WFC's funding cost has fluctuated above and below the FF rate.  Overall, during this period, funding cost has declined from 3.34% to 0.61%.

So the yield on earning assets declined 4.4% while funding cost only declined 2.73% for a spread compression of 1.67%.  There is our 1.6% NIM compression from 5.5% to 4% or so (well, that's kind of obvious in a declining interest rate environment; no charts needed to tell us that!).

It seems like banks are not correlated at all to the yield curve spread, but are now just correlated to long term interest rates.  That can't be good news in this environment.

But let's take a close look at the asset side to see how much of the NIM compression or decline in yield is due to a lower treasury rate and how much due to tighter loan spreads.

Below is the chart that shows the difference between the yield on earning assets spread versus the 10-year treasury rate:

WFC Yield on Earning Assets minus 10-year Treasury Rate
From here, we can see that a lot of the decline is due to a decline in the spread.

WFC yield on earning assets went from 8.97% in 1998 to 4.55% in 2011, a decline of 4.42%.  The ten year treasury rate went from 5.25% to 2.78% during that time (annual averages) for a decline of 2.48%, so 56% of the decline in yield is due to lower interest rates in general.  The rest comes from a decline in the above spread.

Is this due to change in mix or declining loan spreads?  As a quick proxy I just grabbed some data on rates for conventional mortgages and Moody's Baa industrial bond spreads.


Spread Versus 10-year Treasuries: Conventional Mortgages and Baa Industrial
The above chart doesn't show the whole picture, of course, but it doesn't look like spreads are at particularly low levels today than in the past (going back to 1976).

The other explanation obviously has to be asset mix.  In the above chart showing the difference between yield on earning assets and treasuries, it's interesting that the last dip occured in 2002-2003, which were weak years in the economy.   Banks tend to invest in treasuries and other securities and make less loans in a weak economic environments which may be the case now.

Asset Mix
So if the decline in yield on earning assets spread (versus 10-year treasuries) is not due to declining loan spreads, it can only be asset mix.

Here's the asset mix for WFC since 2004:


Well's Fargo's Interest Earning Assets

What I suspected was that during bad economic times, banks would make less loans and invest more in low yielding fixed income securities (like JPM's controversial $370 billion bond portfolio).  WFC management has also said during conference calls that some of the recent NIM declines were due to deposit growth outpacing their ability to make good loans; cash piles up in treasuries and other low-yielding securities decreasing yields on earning assets.

The above table does indeed show an increase in total debt securities available for sale over the past few years.   The only problem with that is that it looks like the yield on available for sale debt securities is actually higher than the total yield on all earning assets (5.21% versus 4.55% in 2011 and 6.63% versus 5.02% in 2010).   This may have something to do with a legacy portfolio from the Wachovia acquisition.

However, it is notable that consumer loans have declined from 49.44% to 38.66% from 2004 to 2011.  That's a pretty large drop, and commercial loans went up from 26% to 30%.   It looks like commercial loan yields are much lower than consumer loan yields so that would certainly be a factor in declining NIM.

I think typically the earnings asset yield is linked to the percentage of total loans to total earning assets (or total assets) as loans tend to have higher yields than securities (that banks typically buy with deposits not lent out).

Below are the figures for WFC:

Breakdown of Total Loans and AFS Debv to Total Assets
So even though yields on AFS debt has been higher than the overall yield, that hasn't always been the case; for a while, consumer loans had much higher yields than AFS debt so over time this may certainly be a factor in declining yields.

To get more color on how all of this impacts yield and NIM, I just jotted down yields on the major earning asset categories at WFC, and here it is:


Yield on Earning Assets by Major Categories (WFC)

I just put the 10-year treasury rate and spread in there for reference; of course we don't know the terms of the loans and they are most likely not 10 years, so this isn't apples to apples.

You will see that consumer loans usually have much higher spreads than the other categories.  So the declining percentage of assets going to consumer loans is a big factor (other than declining overall interest rates, which accounted for about half of the decline in yields since 1998), which makes intuitive sense.

And contrary to the spread chart above where I compared 10-year treasuries to rates on conventional mortgages and Moody's Baa Industrial bond yields, there does appear to be spread compression in WFC's book.  But this, of course, may be due to mix; they may be more selective in making loans and making only high quality loans (and therefore earning less yield).  This is consistent with what is understood to be going on in the industry.   WFC has said in conference calls that they are not seeing spread compression due to competition between lenders.

ROAA and ROAE
So how does all of this affect return on assets and return on equity?  Just out of curiosity I just jotted down the return on average assets (ROAA) and return on average equity (ROAE) of WFC since 1997.


Return on Average Assets and Equity of Wells Fargo
($billions except % and leverage (x))

I also added the ratio of total assets to shareholders equity so we can see how 'leverage' impacts ROE over time.  The argument is that banks can't be as levered as they used to be so looking at this would give us an idea on the impact of such changes in leverage going forward.

Anyway, it looks like despite low interest rates, WFC was able to earn an ROA of 1.25% versus an average since 1997 of 1.42%.  In good times WFC seems to earn ROA of 1.7-1.8% area, and this may be possible again in a stronger economy.  They are earning over 1.0% in this horrible environment so that's encouraging.

ROE at around 12% is slightly below the 15% average since 1997 and that is due to both a slight decrease in leverage and lower ROA. But again, this is in a very weak environment with housing still flat on it's back.


ROAA versus NIM


So naturally, we would want to see ROAA versus NIM to see what declining NIMs has done to it over time.  It looks like WFC was able to maintain decent ROAA despite decreasing interest rates and NIM.  

NIM is not a risk-adjusted figure, so that sort of makes sense.  When you make risky loans, NIM goes up, but so does loan losses.  If you manage the portfolio well, NIM can go down but profits can stay stable if you make better loans and write off less.  This is what I guess is happening at WFC (and other banks).  Non-interest income from fees also helps mitigate the decline in NIMs. 

If the economy starts to pick up and housing starts to move (as many people are starting to expect), then I wouldn't be surprised if WFC starts to earn over 1.5% on assets despite the interest rate environment (and interest rates may go up if housing recovers too, but it may not since global interest rates may be under pressure due to the deleveraging that still needs to take place around the world).


Conclusion
It's interesting to see that despite dramatically lower long term interest rates, the yield curve is still well within the historical range.  If rates stay down here, banks can still do OK as long as they can make decent loans.  There is nothing in the term structure of interest rates now that says banks can't do well.

However, if interest rates keep going down, then this will obviously be a problem.   This would indicate a weak economy for a longer time so loans probably won't increase too much and there may not be much opportunity to make higher yielding loans; increasing credit quality of portfolio may lead to lower and lower yields as has been the case in the past few years.

Obviously the economy would need to pick up for WFC to see loan growth and expanding interest rate margins.

It is interesting to see that NIM continued to decline even in the very strong economy of 2005-2007.  At the time, I think the argument was that irrational, non-banks and securitization markets caused loan rates to go down to unreasonable levels, but that's not really proven in the chart comparing earning asset yields to Treasuries;  the spread was fat in the good years.

In any case, WFC has shown it's ability to earn 1.7%-1.8% return on asset despite declining NIM and long term interest rates. If long term rates don't continue to decline too much and housing starts to turn, it would not be a stretch to imagine WFC doing very well.

Anyway, it looks like NIM declines are not necessarily driven by the yield curve but by lower long term interest rates.  The yield on earning assets have declined partly due to lower long term interest rates and also due to a declining spread on loans, but this seems to be due to asset mix/loan quality issues rather than declining spreads due to competition between lenders.  Much lower portion of the loan portfolio going into consumer loans is a big factor.

So anyway, we are back to what we knew in the first place;  WFC is doing pretty good in this awful environment but can do really well if housing/economy really does pick up (and if consumer loan demand goes up).   If interest rates stay down here, WFC can actually still do well, just not great. 

But if long term interest rates continue to decline and housing doesn't recover, then that will be a problem;  WFC may end up having to put more of their deposits into low yielding Treasuries and that would not be so great.  That would be like the Japan scenario, even though I would think that WFC management would respond more quickly to such a scenario and not just sit there and hope.

Tuesday, June 12, 2012

Market Volatility

So I hear this a lot:  "With HFT (High Frequency Trading), hedge funds, ETFs and instant trading via iPad apps (and mobile smart and dumb phones), the volatility in the stock market is intolerable.  I can't take it anymore.  I'm out!"

Or, "with so many darn MBA's, PHD's and rocket scientists trying to outsmart the stock markets, the markets are way too efficient; there's no way to make money in the market anymore!"

Or how about, "with the revolving door of government and Goldman Sachs, the insider connections, people on the outside don't stand a chance".

Actually, I've been hearing these arguments for years.

Market Volatility
So the market is too volatile?   Yes, with HFTs, hedge funds, ETFs and instant trading at any Joe Schmoe's fingertips, the market is prone to sudden, extreme, irrational moves (never mind that that's actually a *plus* for value investors).

So check this out.  This is a chart of the Dow Jones Industrial Average going a long way back, all the way back to 1902, I think.  That's more than 100 years of history.

Long-Term Dow Jones Industrial Average Chart


I look at this chart and scratch my head.  OK, so where is the last five or ten years more volatile than the past 100 years?  Sure, it's more volatile now than, say, the period between 1994 and 2000 when the market never declined more than 10% off the peak.  Remember that period?  I actually think that was the abnormal period.

But what about the period from 1900 - 1950?  That period actually looks a lot more volatile than now!  And guess what?  No hedge funds. No HFTs.  No ETFs.  Nobody can click a button on a cell phone and hit "sell everything NOW!".  Nope.  No futures or options.  No ISDA-based OTC derivatives.   No CMOs, CDOs, or CLOs.  Not even any banks that are "too big to fail".   Nope. None of that. 

In fact, for most of that period, the U.S. was on a gold standard.


I remember back in the 1990s, people really feared a big, supercrash, much bigger than Black Monday that would be driven by the 1-800-GetMeOutNow mutual fund investors.  The automation allowed anyone to dump their stocks/mutual funds with a single phone call.  This scared the industry  to such an extent that I think some mutual fund companies sought credit lines so they can borrow money to meet redemptions (so they won't have to sell into a crash).

And this only got worse in the 1990s with the internet and online brokers.  So in that sense, it's sort of remarkable that we had the worst recession/financial crisis/bear market since the Great Depression and the stock market only went down 50% off it's high, and we didn't even really have a 'crash' day.  (What happened in 2007-2009 was far worse (in terms of the economy, banks etc.)  than what happened in 1987).

Absolutely remarkable.

I remember last fall when the market was up 300 points one day and down 300 the next or some such.  It was very, very volatile.  But the market basically wasn't going anywhere.  People who know I'm involved in the markets asked me, wow, it must be rough dealing with the markets.  I was like, what do you mean?  The market is not going anywhere!  Up 300 one day and down 300 the next is only a problem if your job was to forecast the closing price every single day or you are a daytrader or whatever...  or if you get fed up and dump your stocks on the 300 point down day and change your mind and get back in on the 300 point up day and keep repeating...  Otherwise, it doesn't matter.

Markets Too Efficient
I think someone asked Joel Greenblatt this question some time back when he was speaking at Columbia or somewhere (I wasn't there; I just read an article about it).  Someone asked that if so many smart folks are rushing to Wall Street to work for these proprietary-trading-focused banks and hedge funds, isn't the market getting pretty efficient leaving less for anyone else?

Greenblatt's answer was that this may be true in some areas of investing, but we still had the internet bubble in 1999/2000 (when these supposedly 'smart', highly educated people rushed into internet stocks).  So go figure.

A lot of hedge funds operate with different strategies.  Maybe some spread businesses get tight (merger arbs, convertible arb etc...) with too much money going into it and a lot of funds these days seem to be sort of macro based, event-driven or whatever.

And the ones people complain about are HFT-like; they trade so often they are only interested in mere basis points in 'edge', measured in microseconds or whatever.

Do value investors really care if someone picks them off for 1 or 2 bps on a trade?   There may be some unfairness with front-running and things like that, but I think overall, the HFT guys are just doing what the NASDAQ market-makers and NYSE specialists used to do but just doing it better and more efficiently.  (You don't think people on the floor had access to privy information and did some front-running too?  Why would there be any value to being physically on the floor of the exchange if there wasn't some sort of informational advantage?  Is some of the anger against HFTs and ETNs based on the fact that much of the informational advantage has moved away from the floor to these other networks that mere humans can't exploit anymore?)


Flash Crash?
I know people bring up the flash crash as an example of computers run amok, but that to me is not a great example as I tend to think that was just a really simple, stupid mistake; somebody (especially the exchanges) just didn't have a filter that 'flagged' trades that didn't make sense (selling something that's trading at $50/share at $0.01 for example...).   The exchange (and trading firm) should have had a simple screen to reject the trade and demand human intervention/confirmation. 

I remember when trading started to get automated on the street.  There were usually all sorts of fat finger filters to prevent these really stupid errors.  It's not rocket science.

People used the flash crash to point out how the specialist system is better. But wait a second.  What happened on Black Monday?  Didn't people just refuse to answer the phone?  Didn't the specialists just bid 20% below last trade? 

And if the specialist/NASDAQ market-maker system is so good and they provide 'liquidity' to the market for smooth price discovery and whatnot, how come stocks opens down 10% or 20% on some overnight news even when there is a specialist in charge of keeping 'orderly' markets?  Where are the market makers then?  This used to happen way before the HFT's started taking share away from the NYSE floor.   I remember waiting for stocks to open down double digit percentages all the time; the specialist wouldn't open the stock until he had enough buy orders to offset the sell orders and he had to keep moving the price down.  You call that providing liquidity to the market and keeping the market orderly?

I'm not picking on the NYSE and specialists.  I'm just trying to point out that it's really not that different; people complain that HFT's can just leave the market in times of turmoil, but my point is that it's not like the NYSE specialists and NASDAQ market-makers stepped up on Black Monday or other 'event' days to provide liquidity.   

The old system had their problems too just as the current system has problems.  You will never make everyone happy. 

The interesting point, though, is that we haven't had a 20% down day *with* HFTs involved *despite* what we went through in the past few years.

I do have an unproven theory why that might be.

Why Didn't We Crash Big During the Financial Crisis?!
Back in the old days, people had no *information*.  People were blind.  Only the privileged had information  (if you were Gomez Addams, you had a private ticker tape in your house).  When you called your broker and said you wanted to buy 100 shares of IBM, you were at the mercy of your broker and the folks on the floor of the New York Stock Exchange.  And the only information you were going to get was in tommorow's newspaper; the opening price, high price, low price and closing price.

Now you can get Level II, Level III or whatever order book in real time etc... 

When people are empowered with information, that allows people to react.  They can see prices on their screen so when something goes down a lot during the day, they can buy some and not just run in blind fear.  I have no proof, but I tend to think that things are much scarier when you just don't know.  And when you don't know, the natural, reflexive action is to just get out first and think about it later.

But that's just my theory on why we didn't have a huge crash in the last financial crisis.  (Information is power!).   The expectation was of massive, simultaneous liquidation including the pro-cyclical, volatility expanding leveraged ETFs.


Old-Timers Complaining
I hear some old school guys complain about the state of the financial markets including the relationship between brokers and clients and blaming the abolishment of Glass-Steagall, but I tend to point to deregulation of commissions in the 1970s and technology as the culprits (both of which I tend to think are good things, by the way).

Way back in the old days, stock brokerage commissions were fixed so there was no price competition.  It didn't matter where you traded so you looked for a relationship; whoever had the best service got the business because the prices were all the same.  This is sort of like when bank deposit rates were regulated and banks fought for customers by giving away toasters.

This changed in 1975 (May 1, 1975 otherwise known as May Day).   This is the beginning of the propietariazation of Wall Street.  If the brokerage business is not as profitable, then they have to put their own capital to work to make money. 

Combine the above with all the information we now have at our fingertips.  The average high school student with an interest in the stock market today can get on the internet way more information than I was able to get as a professional equity trader working at a major bank in the early 1990s.   Maybe even the late 1990s too.  With all that information, what do you need a broker for?  (I do understand that good brokers are very valuable and clients will gladly pay them fees for their services)

Anyone with an internet connection can get all the SEC filings, annual reports at company websites, price and fundamental data at Yahoo Finance, Morningstar etc.  You can even get whisper numbers and analyst upgrades and downgrades.   And you can get all of this for free or at very low prices. (remember Quotron machines?  I am dating myself here...)

This, to me, is one of the big reasons why the industry has changed.  Yes, there are minus factors to all of this (overtrading by retail investors), but I tend to like price competition and free flow of information.


Revolving Door Between Government and Wall Street
So this is another complaint that I hear about a lot, but frankly, I don't get it.  I know, I know.  People hate banks and bankers.  It's Wall Street's fault for causing the housing bubble and then causing it to collapse.   And yes, I'm just a bank loving, capitalist sympathizer. 

But I tend to think of it another way; the best and the brightest people often go to Wall Street.  Yes, Wall Street causes trouble every now and then.  But still, you tend to have a lot of smart, competent people there.   The top school grads still (well, maybe less today) go there etc.

Now, why would I *not* want those "smart" folks to get involved in the government?  (Well, yes, these very same 'smart' people brought us this mess, I know.   There is good reason to be skeptical about the Bernanke (perfect SAT score?) types too (not to mention the award-winning brilliance at Long-Term Capital Management).  But on the other hand, do we really want Wall Street and government to be run by mediocre people?  I'm not too sure about that.)

OK, so some of the best and the brightest go to Goldman Sachs.  Fine.  And some of the best and the brightest go to Washington.  Fine too.  And then they hook up.  What's wrong with that?  People make it seem so evil if a GS guy becomes Treasury secretary and then hires ex-GS guys.  It's a conspiracy.

But wait a minute.  If I took a government job and I needed to hire people to help me, why wouldn't I hire someone I trust?  Why wouldn't those people be people I actually have experience working with?  Or from an institution that I understand and where I come from?  It's totally natural.  I think it's a good thing that that happens, not bad.  If, for example, a GS guy is not allowed to hire another GS guy, or another financial industry person, *that* would be a problem.  How the heck is he going to find qualified people that he knows well and trusts?! 

So what I see going on is not a conspiracy but just a totally natural thing.   I actually think it's good.  Sometimes, I wish there was more back and forth between the private sector and public sector in Japan, for example.  In Japan, bureacrats are professional bureacrats; they have never run anything in their entire lives and understand nothing about business or the real world.  The only back and forth there is between government and business in Japan is "amakudari", or "descent from heaven" or whatever it was called: government officials get board seats at large corporations after retirement with great benefits. 

You'll never see a banker move to the Ministry of Finance, for example (at least at the minister level).  That makes me go hmmm....   Maybe that's why they are having so much trouble over there.


Anyway, there is a long history of people going back and forth between Wall Street and Washington, but I don't think that's because bankers want to go to Washington to represent their interest (even though that may be so in some cases).   Many people, when they get really wealthy often want to do something else and try to help change the world for the better.  I do believe that many go to Washington with good intent even though not everybody going there is Mr. Smith.  

This country was founded by various interests in the first place.  Forgetting about, for the moment, whether any of this is good or bad, it's sort of always been this way and that's no reason to get in or out of the market. 

You could have said the same thing in 1930, 1940, 1950 or 1960 and I don't know that this revolving door is a reason to be in or out of the stock market.

 I don't mean to say everything is A-OK.   I am just sort of pointing out the sameness of everything over time.  Things just look a little different in every generation, but it sort of seems the same to me.